
Ultimate Guide: Best Solar Panels 2026: Engineering Analysis
Ultimate Guide: Best Solar Panels 2026: Engineering Analysis
The Best Solar Panels 2026 are not defined by marketing claims or peak wattage alone, but by a rigorous, multi-faceted engineering analysis. As we navigate the 2026 global energy transition, the technical imperatives for photovoltaic (PV) systems have shifted dramatically. We are moving beyond simple grid-tie systems into an era of resilient, intelligent, and highly integrated energy ecosystems. For engineers, prosumers, and technical buyers, selecting a panel is no longer about the lowest cost-per-watt; it’s about optimizing the Levelized Cost of Energy (LCOE), ensuring long-term material stability, and guaranteeing seamless synergy with advanced energy storage systems (ESS). This guide moves past the superficial specifications found on most websites. We will interrogate the fundamental physics, quantify the system-level interactions, and benchmark the technologies that truly define performance. We will dissect the “why” behind the numbers—from the quantum efficiency of photon harvesting in next-generation cell architectures to the electrochemical stability of integrated battery systems. This is not a consumer review; it is an engineering blueprint for making a technically sound, high-ROI investment in energy independence as we look toward the latter half of the decade. The criteria for “best” are now rooted in quantifiable metrics like temperature coefficient, potential-induced degradation (PID) resistance, and the precision of the handshake between the panel, the charge controller, and the inverter.
The Physics and Chemistry Defining the Best Solar Panels 2026
To truly benchmark the best solar panels 2026, one must look beyond the surface-level efficiency percentage and understand the underlying quantum and electrochemical processes. The performance of a PV module is a story told in electron-volts, semiconductor band gaps, and ionic transfer rates. It is a complex interplay of materials science and electrical engineering that dictates not just peak output, but long-term energy yield and system reliability.
Photon Harvesting & Electron Flow: Beyond the Datasheet
At its core, a solar cell operates on the photovoltaic effect. When a photon with sufficient energy strikes a semiconductor material (typically silicon), it can excite an electron, elevating it from the valence band to the conduction band. This process creates an “electron-hole pair.” An internal electric field, established by the p-n junction (a boundary between p-type and n-type silicon), is critical. This field sweeps the newly freed electrons to the n-side and the holes to the p-side, preventing them from simply recombining. This separation of charge carriers generates a voltage potential across the cell. When connected to an external circuit, this potential drives a current, producing usable power.
However, not all photons are created equal. The Shockley-Queisser Limit dictates the maximum theoretical efficiency of a single-junction solar cell, which is approximately 33.7% for a material with a band gap of 1.34 eV. Why the limit?
- Below-Bandgap Photons: Photons with energy less than the silicon’s band gap (~1.12 eV) pass through the material without being absorbed. Their energy is lost.
- Excess Photon Energy: Photons with energy significantly higher than the band gap are absorbed, but the excess energy (E_photon – E_bandgap) is rapidly lost as heat (thermalization) within picoseconds.
The 2026 frontier is dominated by technologies that mitigate these losses. N-type TOPCon (Tunnel Oxide Passivated Contact) and HJT (Heterojunction) cells are prime examples. They utilize advanced passivation layers (e.g., ultra-thin silicon dioxide and intrinsic amorphous silicon) to drastically reduce surface recombination, a phenomenon where electron-hole pairs recombine at the cell’s surface before being collected. This extends carrier lifetime and boosts open-circuit voltage (Voc), a direct contributor to higher efficiency. For the most advanced research, you can always consult the official NREL Best Research-Cell Efficiency chart, which tracks the bleeding edge of PV technology.
The LiFePO4 Intercalation Process: Storing Your Harvest
A solar panel’s utility is magnified by its ability to store energy. The dominant chemistry for residential and commercial ESS in 2026 is Lithium Iron Phosphate (LiFePO4). Its superiority lies in its electrochemical stability. During discharge, lithium ions (Li+) de-intercalate from the graphite anode and travel through the electrolyte to the LiFePO4 cathode. Simultaneously, electrons flow through the external circuit, powering your load. The process reverses during charging. The “why” behind LiFePO4’s safety and longevity is its robust olivine crystal structure. The strong covalent P-O bonds stabilize the lattice, making it highly resistant to thermal runaway, even under fault conditions—a stark contrast to the less stable layered-oxide structures of NMC or LCO chemistries. This inherent stability allows for a higher cycle life (often >6,000 cycles at 80% Depth of Discharge) and a wider operating temperature range, making it the definitive choice for a long-term battery storage system for home.
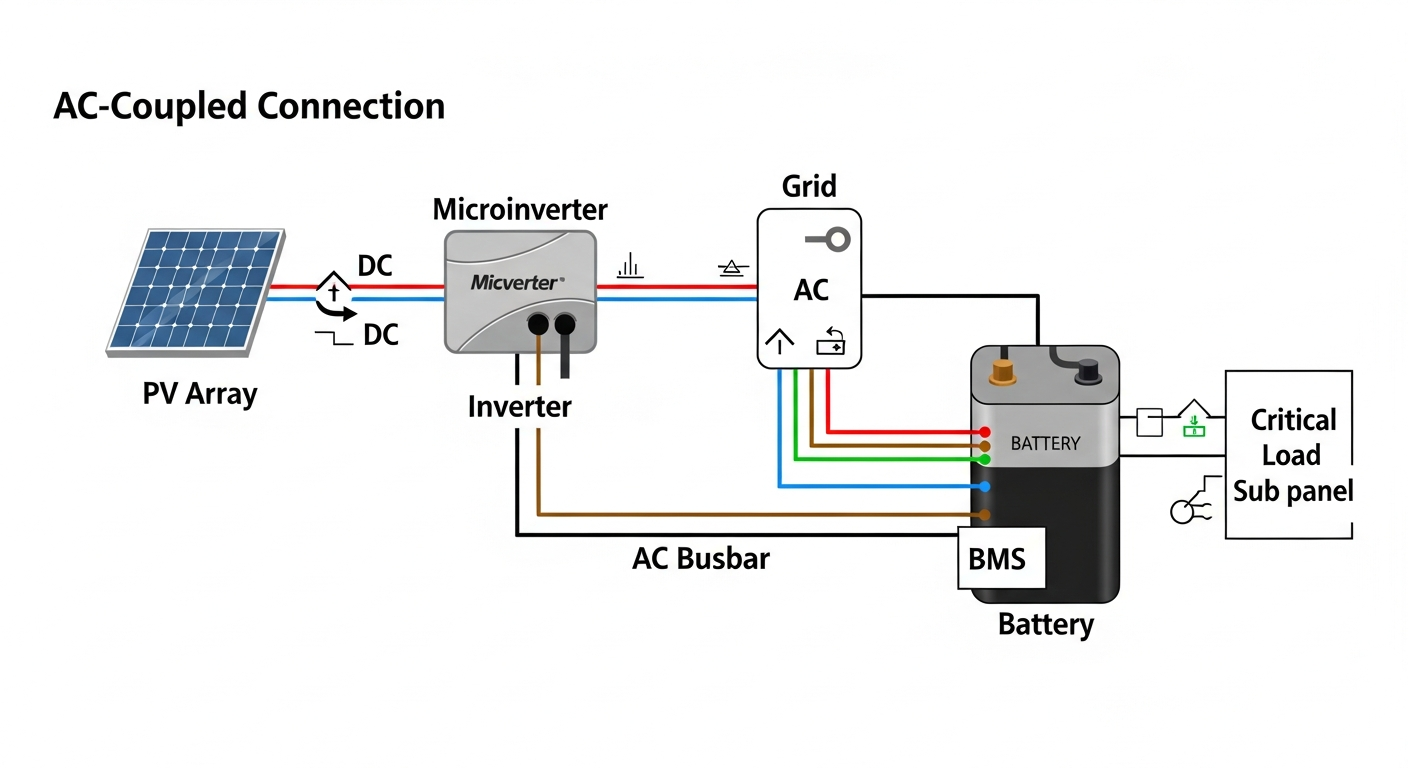
System Synergy: The Critical Handshake Between Components
A high-efficiency panel is only one part of the power equation. The actual delivered energy is dictated by the calibrated interplay between the PV array, the Battery Management System (BMS), the Maximum Power Point Tracking (MPPT) charge controller, and the inverter. This is the system’s central nervous system. The MPPT’s role is to constantly interrogate the panel’s I-V (current-voltage) curve, adjusting the electrical load to operate the array at its maximum power point—a dynamic target that shifts with irradiance and temperature. A sophisticated MPPT algorithm can harvest up to 30% more energy than a simpler PWM controller, especially in variable cloud conditions. The BMS is the guardian of the battery, monitoring cell voltage, temperature, and state of charge. It communicates with the inverter and MPPT to prevent overcharging or deep discharging, which are fatal to battery longevity. Finally, the inverter converts the DC power from the panels or battery into grid-synchronous AC power. The efficiency of this conversion is paramount; a high-quality hybrid inverter achieves >97% efficiency, minimizing thermal losses. Optimizing this entire chain is key, and understanding solar inverter efficiency is a non-negotiable step in system design.
Engineering the Right Fit: Sizing Your System with the Best Solar Panels 2026
Proper system sizing is a fundamental engineering task that prevents under-performance and capital waste. It begins with a detailed analysis of your load profile. Generic online calculators are insufficient; you must quantify your exact daily energy consumption (in kWh), including seasonal variations. You must also account for surge capacity—the high, momentary power draw required to start motors in appliances like refrigerators, pumps, or HVAC units. A system sized only for average load will fail when these surges occur.
The core formula for sizing the PV array is:
PV Array Wattage (Wp) = (Average Daily Energy Consumption [kWh] × 1000) / (Peak Sun Hours [h] × System Efficiency Factor)
Let’s dissect the variables:
- Average Daily Energy Consumption (kWh): The sum of all loads over a 24-hour period. This must be measured, not guessed.
- Peak Sun Hours (PSH): An equivalent measure of the daily solar irradiance. It is NOT the number of daylight hours. A location might have 12 hours of daylight but only 4.5 PSH. This data is available from meteorological databases.
- System Efficiency Factor: This accounts for real-world losses. A typical value is 0.75 to 0.85. It includes losses from inverter inefficiency, wiring (I²R losses), temperature degradation (derating), and soiling.
For battery sizing, the key is autonomy: how many days can the system operate with zero solar input? A common target is 2-3 days. The formula is:
Battery Capacity (Ah) = (Daily Energy Consumption [Wh] × Days of Autonomy) / (Battery Voltage [V] × Depth of Discharge [DoD])
Using a high DoD (e.g., 0.8 for LiFePO4) reduces the required capacity and cost. This level of planning is essential for any serious project, including a DIY solar panel installation.
Master Comparison: Benchmarking the Top 5 Solar Panel Models for 2026
This table benchmarks projected 2026 models based on engineering-critical metrics. We’ve moved beyond simple wattage to focus on LCOE, degradation, and thermal performance, which are the true drivers of long-term value.
| Model (Projected 2026) | Cell Technology | Efficiency (%) | Temp. Coefficient (Pmax) | LCOE (est. $/kWh) | Warranty (Product/Power) |
|---|---|---|---|---|---|
| SolarKiit SK-650-HJT | N-Type HJT | 24.2% | -0.24%/°C | $0.038 | 30 / 30 (90%) |
| Q CELLS Duo G12 TOPCon | N-Type TOPCon | 23.8% | -0.29%/°C | $0.041 | 25 / 30 (89%) |
| REC Alpha Pure-RX | N-Type HJT | 23.5% | -0.25%/°C | $0.040 | 25 / 25 (92%) |
| Maxeon 8 Series (IBC) | N-Type IBC | 24.5% | -0.27%/°C | $0.045 | 40 / 40 (92%) |
| Canadian Solar TopHiKu8 | N-Type TOPCon | 23.2% | -0.30%/°C | $0.043 | 25 / 30 (87.4%) |
Regulatory & Safety Deep Dive: NEC 2026 and UL 9540 Compliance
Deploying a solar and storage system is not just an electrical project; it’s a construction project governed by stringent safety codes. Failure to comply is not an option. The two most critical standards in North America are the National Electrical Code (NEC) and UL 9540.
The NFPA 70: National Electrical Code, particularly Article 690 (Solar Photovoltaic Systems) and Article 706 (Energy Storage Systems), provides the foundational rules. For 2026, we anticipate further refinements to NEC 690.12, “Rapid Shutdown.” This rule is designed to protect first responders by ensuring the DC conductors in a PV array can be de-energized to a safe level (typically <30V) within 30 seconds. Compliance is usually achieved via module-level power electronics (MLPE) like microinverters or DC optimizers that can receive a shutdown signal. All systems must be designed and installed to meet the latest adopted version of this code by the local Authority Having Jurisdiction (AHJ).
For any system incorporating battery storage, UL 9540, the “Standard for Energy Storage Systems and Equipment,” is the paramount safety certification. It is a system-level standard, meaning it evaluates the entire ESS—including the battery cells, the BMS, the inverter, and the enclosure—as a single, integrated unit. It involves rigorous testing for thermal runaway propagation, fire resistance, and electrical and mechanical safety. A UL 9540 listing is non-negotiable for obtaining permits and insurance for a home battery system. Furthermore, large-scale testing is often required to meet UL 9540A, which provides critical data for fire marshals to determine safe installation clearances and fire suppression requirements. Verifying these certifications through a trusted body like UL Solutions (Solar Safety) is a mandatory step in the due diligence process. Fire safety protocols also dictate physical setbacks from property lines and clear access paths for emergency personnel, requirements that must be integrated into the initial system design.
Pillar FAQ: Advanced Engineering Questions Answered
1. How do tandem perovskite-on-silicon cells fundamentally alter the Shockley-Queisser limit?
Tandem cells effectively create a multi-junction device that captures a broader spectrum of light, pushing the theoretical efficiency well beyond the single-junction silicon limit. A perovskite-on-silicon tandem cell is a dual-junction device where a top cell made of a perovskite material is stacked on a bottom cell made of conventional silicon. The engineering genius lies in tuning the band gaps of each layer to work in concert.
- The top perovskite cell has a wider band gap (e.g., ~1.68 eV). It is designed to absorb high-energy photons (blue and green light) efficiently, converting their energy with minimal thermalization loss.
- Lower-energy photons (red and infrared light) that pass through the perovskite layer are then absorbed by the bottom silicon cell, which has a narrower band gap (~1.12 eV) perfectly suited for this part of the spectrum.
This “spectral splitting” approach drastically reduces the two primary loss mechanisms defined by the Shockley-Queisser limit: thermalization and non-absorption. By using two optimized junctions instead of one, the theoretical efficiency limit for a two-junction tandem cell climbs to over 45%, representing the most promising path toward 30%+ commercially viable panels.
2. What is the engineering rationale behind the shift from 1500Vdc to 2000Vdc systems in utility-scale projects?
The primary driver for increasing system voltage to 2000Vdc is to reduce balance-of-system (BOS) costs and improve overall energy yield. This is a direct application of Ohm’s Law (P = V × I) and the power loss formula (Ploss = I²R). By increasing the system voltage (V), the current (I) required to transmit the same amount of power (P) is proportionally reduced. This has several key benefits for large-scale solar farms:
- Reduced Conductor Costs: Lower current allows for the use of smaller-gauge copper or aluminum cables, significantly cutting material costs, which are substantial in a multi-megawatt project.
- Lower Resistive Losses: Since power loss is proportional to the square of the current (I²), halving the current reduces resistive (I²R) losses by a factor of four. This directly increases the amount of energy delivered to the inverters, boosting the plant’s overall performance ratio.
- Increased String Length: Higher voltage allows for more modules to be connected in a single series string, reducing the number of strings, combiner boxes, and associated labor required for a given array size.
The transition requires all components—modules, inverters, and connectors—to be certified for 2000Vdc operation, but the economic and efficiency gains provide a compelling case for this engineering evolution.
3. How does a module’s temperature coefficient directly impact LCOE in high-irradiance climates?
A module’s temperature coefficient is a critical derating factor that directly reduces energy yield, thereby increasing the Levelized Cost of Energy (LCOE), especially in hot climates. The temperature coefficient of Pmax, expressed as %/°C, quantifies how much power the panel loses for every degree Celsius its operating temperature rises above the Standard Test Condition (STC) of 25°C. A typical panel can reach operating temperatures of 65°C or higher.
Let’s quantify the impact:
- A standard panel with a coefficient of -0.40%/°C operating at 65°C (a 40°C rise above STC) will lose: 40°C × -0.40%/°C = 16% of its rated power.
- A superior HJT panel with a coefficient of -0.25%/°C under the same conditions will lose only: 40°C × -0.25%/°C = 10% of its rated power.
This 6% difference in real-world output, compounded over a 30-year lifespan, results in a massive disparity in total energy generation (kWh). Since LCOE is calculated as (Total Lifetime Cost) / (Total Lifetime Energy Generation), the panel with the lower (better) temperature coefficient produces more energy for the same initial cost, directly lowering the LCOE and improving the project’s financial return.
4. Beyond efficiency, what are the key material science indicators of long-term panel durability against PID and LID?
Key indicators are the use of N-type silicon wafers, high-quality encapsulation materials, and specific cell-level passivation techniques. Light-Induced Degradation (LID) and Potential-Induced Degradation (PID) are two primary mechanisms that reduce a panel’s power output over its lifetime.
- LID: This primarily affects P-type silicon wafers, which are doped with boron. The formation of boron-oxygen complexes upon initial light exposure reduces carrier lifetime, causing a 1-3% power loss within the first few hundred hours. The most effective mitigation is using N-type silicon wafers (doped with phosphorus), which are not susceptible to this specific degradation mechanism. This is a major reason for the industry’s shift to N-type TOPCon and HJT cells.
- PID: This occurs when a high voltage potential exists between the cells and the grounded module frame, causing ion migration (particularly sodium ions from the glass) into the cell. This shunts the p-n junction and severely degrades performance. The defense is multi-layered: using high-resistivity, PID-resistant EVA or POE encapsulants that block ion migration, and employing advanced cell architectures with superior surface passivation that are inherently more robust against shunting.
Verifying that a panel uses N-type cells and high-grade, certified encapsulants is a crucial engineering checkpoint for ensuring long-term performance and a low degradation rate.
5. How does the BMS algorithm for a LiFePO4 battery differ from a traditional NMC chemistry to maximize cycle life?
A LiFePO4 BMS algorithm is optimized for a very flat voltage curve and prioritizes precise state-of-charge tracking through coulomb counting over simple voltage-based estimation. Unlike Nickel Manganese Cobalt (NMC) batteries, which have a relatively steep and predictable voltage drop during discharge, LiFePO4 batteries exhibit an extremely flat voltage profile. They hold a nearly constant voltage for about 80% of their discharge cycle before a sharp drop-off at the end.
This presents a unique challenge and requires a more sophisticated BMS:
- State of Charge (SoC) Estimation: Relying on voltage alone to determine SoC is highly inaccurate for LiFePO4. The BMS must employ a “coulomb counting” (Amp-hour integration) algorithm. It meticulously tracks the current flowing in and out of the battery to maintain an accurate SoC “fuel gauge.” This primary method is periodically recalibrated with voltage readings at the top and bottom of the charge cycle where the curve is steeper.
- Cell Balancing: Because the voltage curve is so flat, even tiny voltage differences between cells can represent significant SoC imbalances. The BMS must perform more frequent and precise “top balancing” (during the final stage of charging) to ensure all cells reach a full charge simultaneously, preventing the overcharging of any single cell, which is critical for maximizing the entire pack’s cycle life.
This algorithmic focus on current integration and proactive balancing is fundamental to safely harnessing the superior cycle life of the Best Solar Panels 2026.
📥 Associated Resource:

El Kouriani Abde Civil Engineer & Founder of SolarKiit
El Kouriani Abde is a seasoned Civil Engineer and Project Manager with over 21 years of field experience. As the founder and publisher of SolarKiit.com, he leverages his deep technical background to simplify complex renewable energy concepts. His mission is to provide homeowners and professionals with accurate, engineering-grade guides to maximize their solar investments and achieve energy independence.