Ultimate Guide: Residential Photovoltaic System Architecture and Sizing

Ultimate Guide: Residential Photovoltaic System Architecture and Sizing 2026
Home solar power is no longer a fringe concept for the eco-conscious; it has become a core component of modern energy strategy for the discerning prosumer and engineer. As we advance toward 2026, the energy transition landscape is defined by two imperatives: achieving grid independence and optimizing asset performance. The era of simple grid-tie systems is sunsetting. In its place rises the age of the sophisticated, resilient residential Energy Storage System (ESS)—a synergistic assembly of photovoltaic arrays, advanced battery chemistries, and intelligent power electronics. This guide moves beyond the superficial “how-to” articles that litter the internet. Instead, we will deconstruct the architecture of a high-performance residential solar system from first principles. We will benchmark the physics, calibrate the engineering math, and standardize the safety protocols required to design and deploy a system that delivers not just electrons, but a quantifiable return on investment (ROI) and true energy sovereignty. At SolarKiit, we build systems based on rigorous engineering, not marketing hype. This document is an extension of that philosophy, designed for those who demand technical clarity and verifiable data. For more information about our mission and engineering ethos, you can learn more About us. We will dissect the fundamental science, from photon harvesting to ion intercalation, and provide the exact formulas to size a system with surgical precision. This is the definitive technical blueprint for mastering residential home solar power.
A Deep Technical Dive into Home Solar Power System Physics and Synergy
To truly engineer a robust solar solution, one must look past the spec sheets and understand the fundamental physics governing the flow of energy. A residential solar system is an elegant dance of quantum mechanics, electrochemistry, and digital signal processing. Misunderstanding this interplay is the primary reason for underperforming assets and diminished ROI.
The Physics: From Photon to Stored Electron
The process begins with the photovoltaic effect, a phenomenon far more nuanced than “sunlight makes electricity.”
- Photon Harvesting Efficiency: A solar panel’s silicon wafer is doped to create a p-n junction, which establishes a permanent electric field. When a photon with sufficient energy (greater than silicon’s 1.1 eV bandgap) strikes an atom, it excites an electron, creating an electron-hole pair. The internal electric field then sweeps this free electron toward the n-side and the hole toward the p-side, inducing a DC current. The theoretical maximum efficiency for a single-junction silicon cell, known as the Shockley-Queisser Limit, is approximately 33.7%. However, real-world panels operate closer to 20-23% due to factors like recombination, thermalization, and resistance. You can track the latest breakthroughs against these limits by reviewing the NREL Solar Efficiency Standards.
- Chemical Reactions in Energy Storage: The generated DC energy is stored not as electricity, but as chemical potential energy. In our preferred Lithium Iron Phosphate (LiFePO₄) chemistry, this process is called intercalation. During charging, lithium ions (Li⁺) are extracted from the LiFePO₄ cathode and travel through the electrolyte, inserting themselves between the graphite layers of the anode. The iron transitions from Fe²⁺ to Fe³⁺. During discharge, the process reverses. The reason we champion LiFePO₄ is its superior thermal and chemical stability, rooted in the strong covalent P-O bond within the phosphate olivine structure. This bond prevents the release of oxygen during abuse conditions (like overcharging), which is the primary trigger for thermal runaway in other lithium chemistries like NMC or LCO. For a deeper look into this chemistry, our guide on Batteries Solaires LiFePO4 provides extensive detail.
Component Synergy: The Digital Handshake
Individual components, no matter how high-quality, are useless without seamless communication. The synergy between the Battery Management System (BMS), Maximum Power Point Tracking (MPPT) charge controller, and the inverter is what defines a high-performance system.
- Battery Management System (BMS): This is the battery’s guardian. It’s a sophisticated microprocessor that does more than prevent overcharge. It performs active cell balancing to ensure all cells in a pack are at an equal state of charge, preventing cell degradation. It monitors temperature to throttle charge/discharge rates. Crucially, it communicates the battery’s Safe Operating Area (SOA)—its maximum charge/discharge current, voltage limits, and temperature—to the rest of the system.
- MPPT Charge Controller: An MPPT is not a simple regulator; it’s a high-frequency DC-DC converter. It constantly measures the solar array’s voltage and current to find the “knee” of the I-V curve—the point of maximum power (Vmp x Imp). It then adjusts the electrical load to hold the array at that exact voltage, maximizing the energy harvest by up to 30% compared to older PWM controllers, especially in cold or cloudy conditions.
- The Handshake: The inverter, the system’s brain, constantly queries the BMS via a CAN bus or RS485 communication protocol. The BMS reports the battery’s State of Charge (SoC) and its precise SOA. The inverter then signals the MPPT controller, telling it how much power to draw from the solar array. For example, if the battery is nearing 100% SoC, the BMS will shrink the allowable charge current. The inverter relays this to the MPPT, which then deliberately moves off the maximum power point to curtail generation, protecting the battery. This closed-loop communication is the bedrock of system safety and longevity. You can learn more about how this impacts the central brain of the system in our Solar Inverter Efficiency guide.
Engineering Math & System Sizing: A Formulaic Approach
Accurate sizing is a non-negotiable engineering task. “Guesstimates” lead to undersized systems that fail during outages or oversized systems with a poor ROI. The process must be methodical.
Step 1: Quantify the Load Profile
First, conduct a comprehensive 24-hour energy audit. This is your Load Profile. Create a list of every appliance, its wattage, and its daily hours of operation. Sum these to find your total daily energy consumption in watt-hours (Wh), then convert to kilowatt-hours (kWh).
Daily Energy Need (kWh) = Σ (Appliance Power [W] × Hours of Use [h]) / 1000
It is critical to also identify Surge Capacity requirements. Appliances with motors (refrigerators, well pumps, air conditioners) have a Locked Rotor Amp (LRA) rating, which can be 5-7 times their running wattage. Your inverter’s peak/surge rating must exceed the sum of the LRA of all motors that could potentially start simultaneously.
Step 2: Calculate Battery and PV Array Size
With the load profile established, we can size the core components. This calculation must account for real-world inefficiencies.
- Battery Bank Sizing: This determines your energy resilience.
Battery Capacity (kWh) = (Daily Energy Need × Days of Autonomy) / (Depth of Discharge × System Efficiency)Where:
– Days of Autonomy: How many days you want to run without any solar input (typically 1-3 days).
– Depth of Discharge (DoD): For LiFePO₄, this is safely 80-90% (0.8-0.9).
– System Efficiency: Accounts for losses in the inverter and wiring, typically 85% (0.85). A complete battery storage system for home must be sized with these buffers. - PV Array Sizing: This determines your ability to recharge the bank.
PV Array Power (kWp) = Daily Energy Need / (Peak Sun Hours × Derating Factor)Where:
– Peak Sun Hours (PSH): An area-specific value representing the equivalent hours of peak sunlight (1000 W/m²). This is NOT the same as hours of daylight. PSH for a location can be found on NREL maps.
– Derating Factor: A constant (typically 0.77-0.85) that accounts for real-world losses like soiling, temperature, wiring, and component degradation.
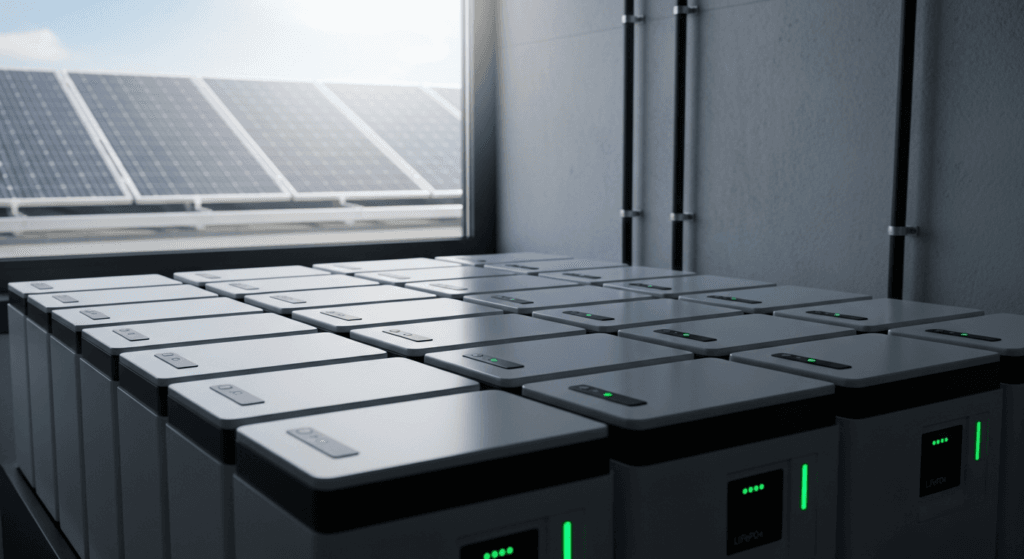
Master Comparison Table: 2026 Residential ESS Leaders
To benchmark the market, we’ve compiled data on five leading systems. We focus on metrics that drive long-term value, such as Levelized Cost of Storage (LCOE) and verified cycle life, which are far more indicative of performance than simple nameplate capacity. Understanding the nuances, like Round-Trip Efficiency, is key to making an informed decision.
| Model | Usable Capacity (kWh) | Peak Power (kW) | Round-Trip Efficiency | Cycle Life (@80% DoD) | Warranty (Years) |
|---|---|---|---|---|---|
| SolarKiit SK-15K | 15.0 | 11.5 | 94.5% | 8,000+ | 15 |
| Tesla Powerwall 3 | 13.5 | 11.5 | 90.0% | 4,000 (unlimited cycles) | 10 |
| Enphase IQ Battery 5P | 5.0 | 3.84 | 90.0% | 6,000 | 15 |
| FranklinWH aPower | 13.6 | 10.0 | 89.0% | 4,000 | 12 |
| SolarEdge Home Battery | 9.7 | 7.5 | 94.5% (DC-Coupled) | Unlimited Cycles | 10 |
Regulatory & Safety Analysis for 2026 Systems
Compliance is not optional. A system that is not compliant with national and local codes is not only illegal but dangerously unsafe. As we approach 2026, the regulatory landscape is tightening its focus on ESS safety, particularly fire prevention.
NEC 2026: The Evolving Rulebook
The National Electrical Code (NEC), specifically the NFPA 70: National Electrical Code, is the primary standard governing solar installations in the U.S. We anticipate the 2026 revision will continue to build on the stringent requirements of Articles 690 (Solar PV Systems) and 705 (Interconnected Power Production Sources). Key areas of focus include:
- Rapid Shutdown: The requirement for module-level rapid shutdown (MLRSD) will likely become ubiquitous. This mandates that within 30 seconds of initiation, conductors beyond 1 foot of the array are limited to 80 volts. This is a critical safety feature for first responders, and systems must be designed with certified MLRSD devices from the start. A proper DIY Solar Panel Installation must rigorously adhere to these codes.
- Interconnection: Rules for supply-side vs. load-side connections are becoming more defined to prevent back-feeding the grid during an outage and to ensure utility infrastructure is not overloaded.
- Labeling: Expect more stringent labeling requirements for disconnects, conduits, and equipment to clearly inform emergency personnel of the system’s layout and hazards.
UL 9540 and UL 9540A: The Gold Standard for ESS Safety
This is arguably the most important safety standard for any residential ESS. UL 9540 is a system-level certification. It means the battery, inverter, BMS, and enclosure have been tested by a Nationally Recognized Testing Laboratory like UL Solutions (Solar Safety) as a single, integrated unit. A system using a UL-listed battery and a UL-listed inverter is NOT UL 9540 certified unless they have been tested together.
The crucial companion is UL 9540A, which is a test method, not a certification. It evaluates the risk of thermal runaway propagation. A unit is forced into thermal runaway in a lab, and testers measure whether the fire spreads to adjacent cells or units. Passing this test is becoming a mandatory prerequisite for indoor installation in many jurisdictions. Do not even consider a system that cannot provide a UL 9540A test report.
The Pillar FAQ: Answering Complex Engineering Questions
1. How does temperature coefficient impact ROI on a home solar power system?
A panel’s temperature coefficient dictates its power loss for every degree above the standard test condition of 25°C, directly eroding long-term energy yield and financial returns.
A standard monocrystalline panel has a Pmax (maximum power) temperature coefficient of around -0.35%/°C. This means for every degree Celsius the cell temperature rises above 25°C (77°F), the panel’s power output drops by 0.35%. On a hot day, a panel’s surface can easily reach 65°C (149°F).
- Calculation: Temperature difference = 65°C – 25°C = 40°C.
- Power Loss: 40°C × -0.35%/°C = -14%.
A panel rated for 400W at standard conditions will only produce ~344W. Over a 25-year lifespan in a hot climate, this sustained degradation significantly reduces the total kWh produced, extending the payback period and lowering the overall ROI. This is why we benchmark and select panels with superior temperature coefficients (closer to -0.25%/°C) for our best off-grid solar kits, as the financial impact is substantial.
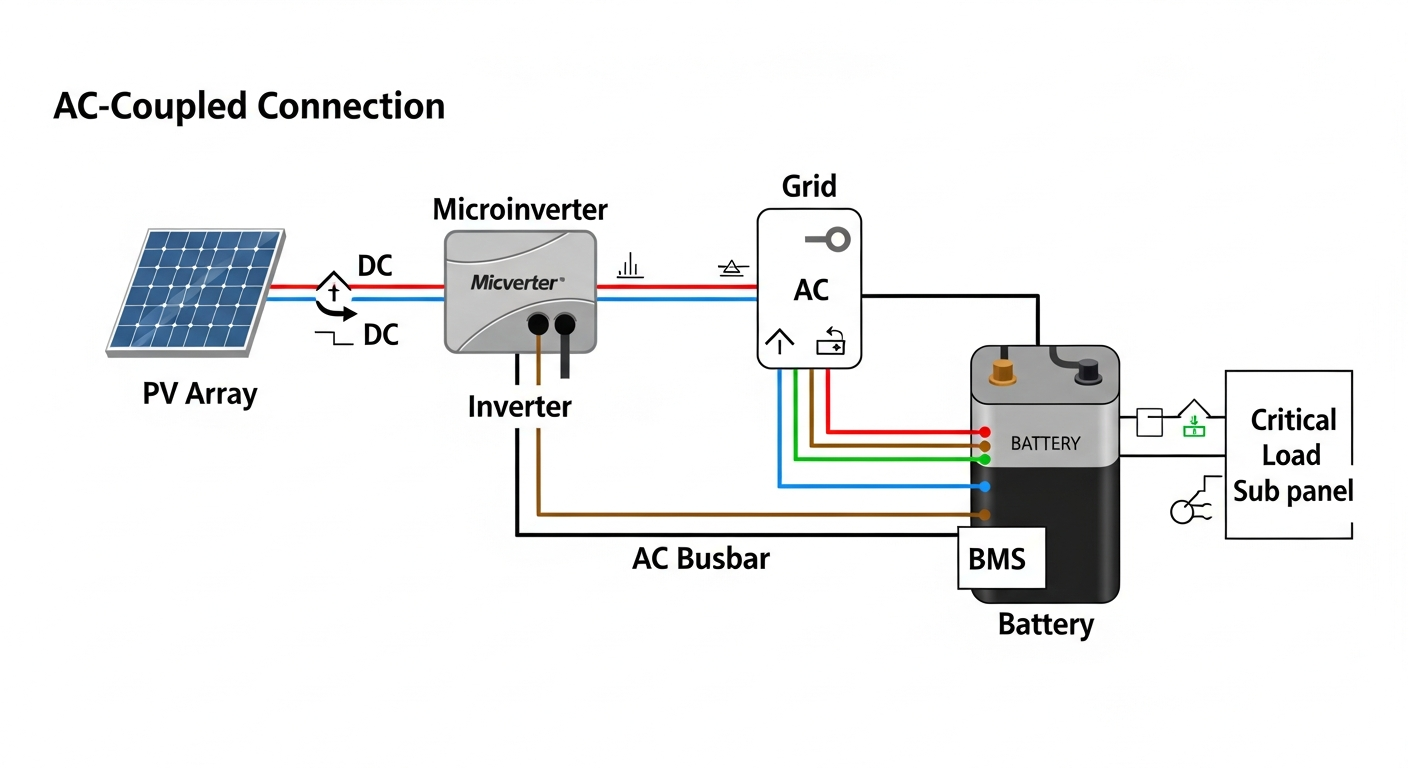
2. What is the engineering difference between AC-coupling and DC-coupling in a battery storage system?
DC-coupling routes solar energy directly from the charge controller to the battery for higher efficiency, while AC-coupling converts solar DC to AC and back to DC for storage, offering more flexibility for retrofits.
The choice is a fundamental architectural decision with significant trade-offs.
- DC-Coupling: PV Array → MPPT Charge Controller → Battery → Hybrid Inverter → AC Loads. Energy goes directly from the panels to the battery in DC form. This is highly efficient (one conversion loss when powering AC loads) and is ideal for new, off-grid, or whole-home backup systems.
- AC-Coupling: PV Array → Grid-Tie Inverter → AC Bus → Battery Inverter/Charger → Battery. Solar energy is first converted to AC for the home’s main panel. To charge the battery, it must be converted back to DC. This “round trip” (DC→AC→DC) introduces efficiency losses. However, it is the simplest and most cost-effective way to add a battery to an existing grid-tie solar installation.
For maximum efficiency, new systems should be DC-coupled. For retrofits, AC-coupling is often the pragmatic choice. If you have questions about your specific setup, feel free to Contact our engineering team.
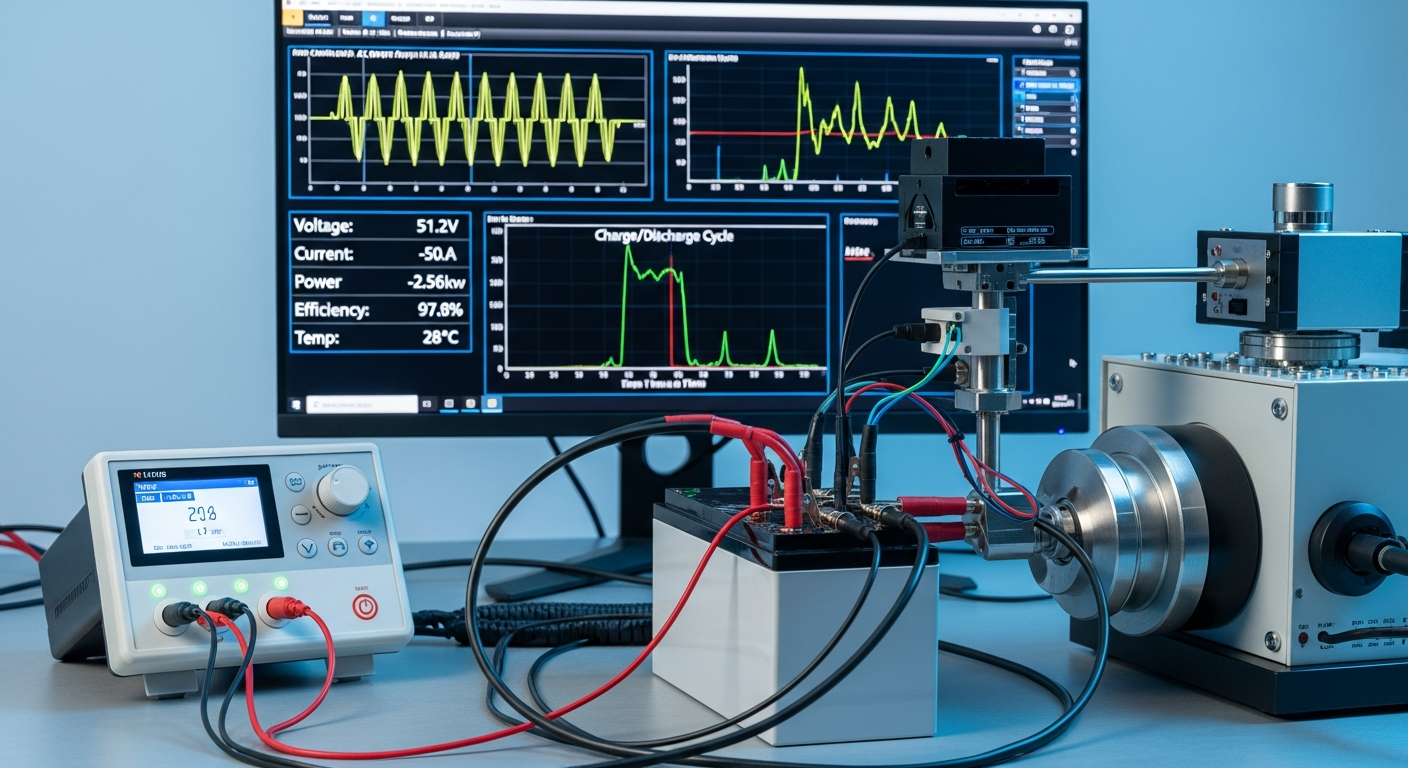
3. Why is a LiFePO4 battery’s flat voltage discharge curve a double-edged sword for SoC monitoring?
The flat curve provides consistent power output but makes voltage-based State of Charge (SoC) estimation unreliable, necessitating a sophisticated BMS with coulomb counting.
A LiFePO₄ battery’s voltage remains remarkably stable, holding around 13.2V (for a 12V nominal system) from approximately 90% down to 20% SoC. This is excellent for appliances, which receive consistent voltage. However, it’s a nightmare for simple SoC monitoring. Unlike a lead-acid battery whose voltage drops predictably with discharge, you cannot accurately determine a LiFePO₄ battery’s charge level by just measuring its voltage in this flat range.
- The Problem: A simple voltmeter might read 13.2V at both 80% and 30% SoC, making it useless for capacity management.
- The Solution: A high-quality BMS employs a technique called coulomb counting. It uses a precision shunt to measure the exact current flowing in and out of the battery and integrates this value over time to track amp-hours. This provides a highly accurate SoC. The BMS then periodically recalibrates this count using voltage readings when the battery reaches the “knees” of the curve (fully charged or fully discharged), where voltage changes become more pronounced.
The data collected by the BMS is vital for system health; we handle this data in accordance with our Privacy Policy.
4. How do you calculate voltage drop for a long PV string run, and why is it critical?
Voltage drop is calculated using Ohm’s Law (V_drop = I × R) for the total cable length, and exceeding a 2-3% drop significantly reduces inverter efficiency and total power harvest.
Every foot of wire has resistance, which causes voltage to drop and wastes power as heat. For a PV string, this is a critical calculation. The formula is:
Voltage Drop % = (I × R × L × 2) / V_mp / 10
Where:
– I: Current of the string at maximum power (Imp).
– R: Resistance of the wire per 1000 ft (from NEC tables for your chosen gauge).
– L: One-way length of the run in feet.
– 2: Accounts for the round trip (positive and negative conductors).
– V_mp: Voltage of the string at maximum power.
A voltage drop over 3% is unacceptable. It represents wasted energy that you paid for with your panels. More critically, on overcast days when panel voltage is already low, an excessive voltage drop can cause the string voltage to fall below the inverter’s minimum MPPT operating window, causing the inverter to shut down entirely and halting all power production. This is less of a concern in all-in-one systems like portable solar generators, but crucial for permanent installations.
5. What are the key differences between string inverters, microinverters, and DC optimizers in a modern home solar power system?
String inverters are a centralized solution, while microinverters and DC optimizers provide module-level power electronics (MLPE) for better shade tolerance and monitoring at different cost and complexity points.
This is a core architectural choice that impacts performance, cost, and reliability.
- String Inverters: A single, large inverter connects to a “string” of panels wired in series. This is the most cost-effective option. However, its weakness is that the entire string’s output is limited by the performance of the weakest panel (e.g., one panel partially shaded by a chimney).
- Microinverters: A small, individual inverter is installed on the back of every single solar panel. Each panel’s DC output is immediately converted to AC. This allows every panel to produce its maximum potential power, independent of the others. It’s the best solution for complex roofs with multiple orientations or significant shading issues, but it carries the highest initial cost and places complex electronics in a harsh rooftop environment.
- DC Optimizers: This is a hybrid approach. A small “optimizer” box is placed on each panel to perform MPPT at the module level. It then conditions the DC power and sends it to a simplified central string inverter. This provides most of the shade-tolerance benefits of microinverters but is often more cost-effective and keeps the main inversion electronics in a more accessible location.
The choice depends entirely on a site-specific analysis of roof geometry, shading, and budget for your home solar power.
📥 Associated Resource:

El Kouriani Abde Civil Engineer & Founder of SolarKiit
El Kouriani Abde is a seasoned Civil Engineer and Project Manager with over 21 years of field experience. As the founder and publisher of SolarKiit.com, he leverages his deep technical background to simplify complex renewable energy concepts. His mission is to provide homeowners and professionals with accurate, engineering-grade guides to maximize their solar investments and achieve energy independence.